Ever played a video game and felt your computer get hot? This heat comes from your GPU or Graphics Processing Unit. It creates all the fancy visuals on your monitor. But like a hard worker, it can get hot when pushed. So, it’s key to know how to check GPU temp.
How hot is too hot, though? It’s essential to monitor your GPU’s temperature to keep it working well and avoid harm. This guide will help you understand how to check GPU temp, whether you’re an experienced gamer or a pro pushing your machine’s limits.
Here’s the info you need on ‘how to check GPU temp’ on different operating programs, plus, command centres, tips to keep your GPU cool, and more.
Why Monitoring GPU Temperature is Important
Like a hard-working engine, your GPU produces heat while sorting data. It’s okay, but too much could cause problems:
- Performance Throttling: A heated GPU slows down trying to chill. This can cause game issues, like lag and low frame rates, ruining the fun.
- Reduced Lifespan: Intense heat can cut your GPU’s life short, hurting the inside parts. Over time, this could cause lasting harm and your hardware may fail.
- System Instability: An overheated GPU can create system chaos, causing sudden crashes and shutdowns.
Here’s why it matters to watch your GPU temperature:
- First, it’s like your Heads-up Display: Keeping tabs on GPU temps helps you spot trouble before huge problems happen.
- Second, it’s about Peak Performance: Your GPU works best within certain temperature limits, and this stops it from slowing down.
- Thirdly, it’s about Prevention: Tracking temperature lets you find issues like weak airflow or broken fans early. This helps you to fix things before any damage.
So, simply put, watching your GPU temperature is a key habit for gamers or professionals who rely a lot on their graphics card. It helps dodge annoying drops in performance, expensive repairs, and can even stop your whole system from crashing.
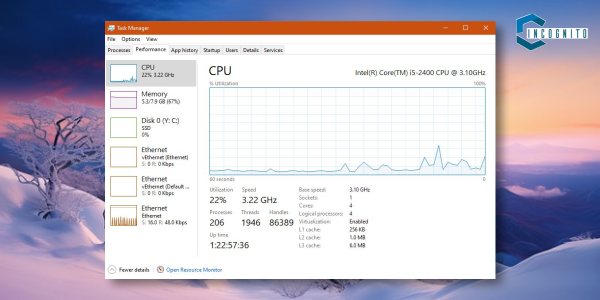
How to check GPU Tech Using Task Manager
Different Ways to Check Your GPU Temp
Want to know how to check GPU temp? There are a few ways you can do that. They each have their own details and customization features. Let’s learn about some common methods:
1. Using Windows Task Manager for basic checking.
The great thing is that Windows 10 and 11 have a special tool called Task Manager. With this tool, you can get simple info about your GPU temperature. Here’s the method:
- On your keyboard, push Ctrl + Shift + Esc. This opens the Task Manager.
- Go to the “Performance” section.
- If the “GPU” part is hidden, open it up. Your GPU temperature will be there.
Plus point: Quick to reach, no extra software required.
Minus point: It doesn’t provide a lot of info. Only displays the current temperature without past data or detailed statistics.
2. Using GPU Manufacturer Software (For NVIDIA and AMD Users)
NVIDIA and AMD both have handy software suites. They give you all you need to know about your graphics card, like how to check GPU temp. Here’s a quick walk-through:
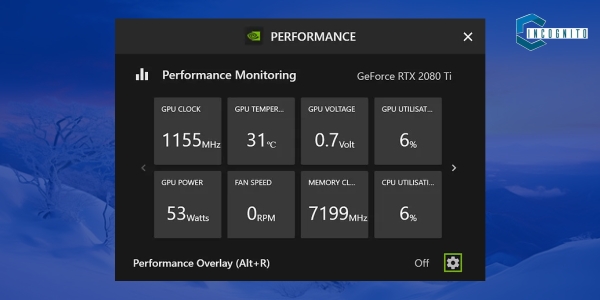
How to check GPU Temp using NVIDIA Tool
NVIDIA has GeForce Experience.
- You can get this from the NVIDIA website [NVIDIA GeForce Experience].
- Once you have it and open it, click “Performance.”
- You will then see lots of info about your GPU. This includes temperature, fan speed, and clock speeds.
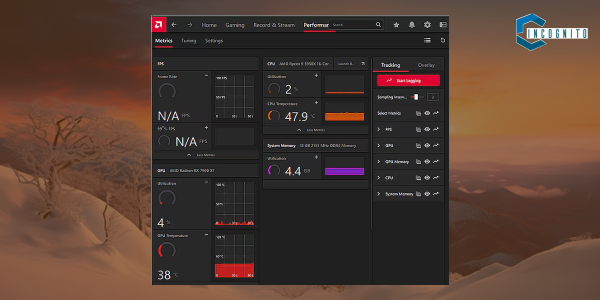
How to check GPU Temp using AMD Radeon
AMD has its Radeon Software.
- Grab this off the AMD website [AMD Radeon Software].
- Open it and go to “Performance.”
- You will see a load of info about your GPU, such as temperature, fan speed, and utilization.
Plus point: It’s easy to use and gives detailed info about your GPU model, and may also have handy extras like tools for overclocking.
Minus point: You’ll need to download and install extra software, and it may not work with all graphics cards.
Third-Party Monitoring Tools
3. Third-Party Monitoring Tools (For Expert Use)
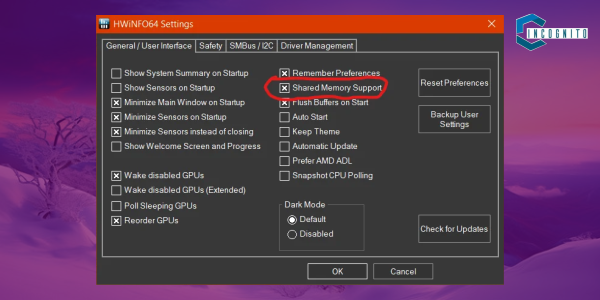
More detailed knowledge about how to check GPU temp and tweaks can be achieved via a few tools available. Here’s two famous ones:
- MSI Afterburner: A powerful tool giving real-time reports of several hardware parts, such as GPU heat, fan’s speed, and electric voltage. It’s got overclocking capabilities too, for seasoned users (be careful!).
- HWiNFO: This elaborate system watch tool gives deep details on all hardware parts, down to your GPU’s sensor readings.
Plus Point: Super customizable, tons of info, allows detailed supervision and data recording.
Minus Point: Might be too much for newbies, some features demand high tech knowledge.
How to check GPU Temp For Alienware Laptops
4. How to check GPU Temp For Alienware Laptops (and Dell G5s)
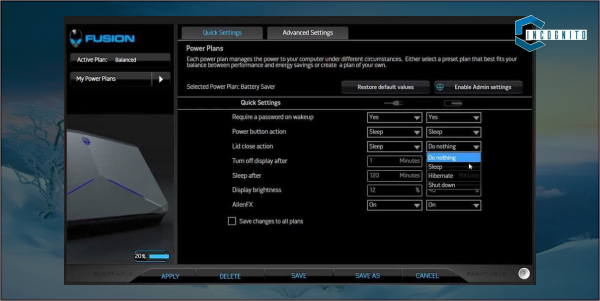
Got an Alienware laptop? Use the Alienware Command Center already on your system. This tool does a bunch of things, like tracking system performance. how to check GPU Temperature? Follow these steps with the Alienware Command Center:
- Open the ACC.
- Hit the “Thermal” icon (looks kinda like a flame).
- Now, you can see your GPU temperature. Other system temperatures show up too.
- This tool can even tweak cooling options to control your GPU temperature.
Plus Point: It’s easy to use for Alienware folks and has extra system performance controls.
Minus Point: Only works with Alienware systems. Might not have as much detail or customization like other tools.
Built-in overlays for Temp Check
Checking GPU Temp While Gaming and Doing Professional Work
Want to keep your GPU performance in check? It’s important for avid gamers and pros alike. Let’s simplify how to check GPU temp.
For Gamers:
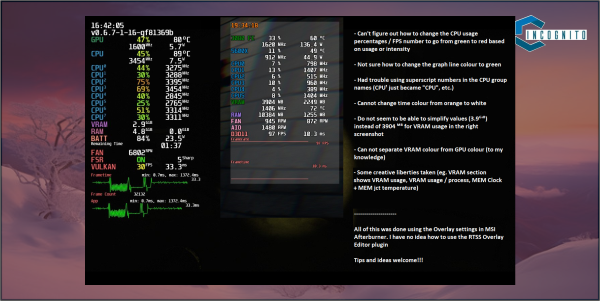
- Play with overlays: Many games come with built-in overlays showing performance stats, including GPU temp. Explore your game settings for performance monitoring or overlay options.
- On-Screen Monitoring with Third-Party Tools: Check out tools like MSI Afterburner. They let you set up an on-screen display (OSD) that shows important data, like GPU temp, over your game. No need to pause your game, stay in the loop at all times.
For Professionals:
- Alert System with Third-Party Tools: Using heavy apps like video editors or 3D renderers? Keep a monitoring tool open in the background. Tools like HWiNFO allow you to set alerts for specific temperature limits, letting you know if your GPU heats up above safe levels.
- Clear out unnecessary apps: Before kicking off heavy-duty professional workload, shut down background applications.
Checking GPU temp on macOS
Checking GPU Temperature on Different Operating Systems
Regardless of your operating system, keeping track of your GPU’s heat level is key. Here’s a guide for different systems:
For Windows (discussed earlier):
- Use your Task Manager as a simple check for the current temp.
- Your GPU Manufacturer Software (such as NVIDIA GeForce Experience or AMD Radeon Software) can offer detailed info and bonus features.
- Tools like MSI Afterburner or HWiNFO are third-party options that are fully customizable with advanced features.
If you’re a macOS user:
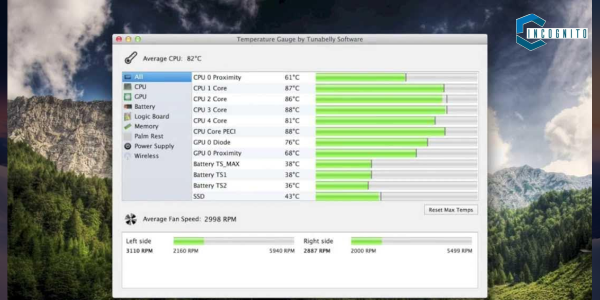
- Open the Activity Monitor (you’ll find it in Applications > Utilities) and travel to the “Energy” tab. This spot shows you your total GPU power use, which can hint at the temperature.
- Third-party tools like iStat Menus or HWMonitor also exist that give more thorough features for monitoring, like direct GPU temp info. Install these from trusted sources.
How to check GPU Temp On Linux:
- Linux provides console utilities like “sensors” or “lm-sensors” which can relay info on different system sensors, the GPU’s temperature as well (it depends on your hardware). Knowing how to use these tools might demand some Linux terminal knowledge.
- A whole range of desktop settings in Linux offer environment monitoring tools with the ability to show GPU temperature. (KDE Plasma System Monitor/GNOME Shell Extensions)
Note: Instructions can change a bit between OS versions and tools, but the basic idea of checking GPU temperature stays the same. For macOS and Linux users, third-party tools often prove easier to use than console options.
Safe Temperature Range for Your GPU
What’s a Safe Temperature Range for Your GPU?
Gone are the days when simply identifying your GPU’s temperature was enough; understanding the safe temperature range for your particular GPU is now important. Going beyond these limits can’t spark instant explosions (🤞), but it could lead to lasting harm and performance problems. Here’s what to think about:
General Safe Zones:
- Ideal: It’s a good guideline to target temperatures from 65°C (149°F) to 85°C (185°F) when gaming or using powerful apps. This range enables your GPU to work excellently without hitting danger zones.
- Acceptable: Ranges between 85°C (185°F) and 95°C (203°F) are typically seen as tolerable but not preferable for extended phases. If your GPU consistently hits these levels, think over your cooling measures.
- Caution Zone: Anything beyond 95°C (203°F) is alarming. It means your GPU runs extremely hot and could face sluggishness or possible damage with extended heat exposure. (To put it more simply you’ll experience throttling)
Just remember, these are just basic rules of thumb.
Your GPU’s healthy temperature will vary based on some factors.
- GPU Model: An NVIDIA, an AMD, or any other maker’s GPU models have different temp tolerances.
- Workload: Playing games will push your GPU more than simple tasks, leading to warmer temps while gaming.
- Cooling System: How well your computer’s cooling system (like case fans and GPU cooler) works can heavily influence its operating temperature.
- Ambient Temperature: A hot room makes your GPU work overtime to stay cool, which might push it over safe levels.
Here’s how to figure out the best temperature for your specific GPU:
- Identify your GPU model: Simply right-click on the Start menu (If you’re using Windows) and go with “Device Manager.” Open up the “Display adapters” section and write down your GPU model name.
- Search online: Go online and look up the official specs for your GPU model. The maker’s website or tech sites usually give a good range of operating temperatures.
How to check CPU Temp
Additional how to check CPU Temp
Did you know you could check not just your GPU, but your CPU temperature too? Yes, both generate heat while running. Keeping an eye on CPU temp helps make sure your system continues to work smoothly. So how do we do it? Figuring your CPU Temp It’s quite similar to the way we do it with GPUs.
Here’s a couple of popular methods:
- Using Other Monitoring tools: Many of the GPU tools we discussed before (like MSI Afterburner, HWiNFO, and others) can also show CPU temperature along with other system info. They offer customizable and detailed monitoring.
- Windows Task Manager (Basic Monitoring): Task Manager gives basic CPU temp readings, much like it does for GPU temperature. Simply start up Task Manager (Ctrl + Shift + Esc), hit the “Performance” tab and you’ll see the CPU’s usage and temp.
Safe CPU Temperature Range:
GPUs and CPUs share a safe operating temperature level. Most times, if a CPU’s heat is between 40°C (104°F) to 65°C (149°F) under a decent load, it’s perfect. If the temperature hits 75°C (167°F) for a long time, there might be cooling issues. To find the ideal CPU temp, do the same process as for GPUs. Here’s how:
- Identify your CPU model by opening Task Manager and clicking on the “Performance” then “CPU” tab. The model name appears.
- Search the internet for your CPU model. Usually, the maker’s website or tech review pages will show the ideal temperature.
Monitoring the temp of your CPU and GPU together provides a total picture of your system’s thermal state. It helps you spot any cooling issues and keep your CPU and GPU working in the right temperature range. This will make sure the performance and lifespan of both are great.
To conclude:
Wrapping it up, how to check GPU temp is pretty easy and super important for any gamers or pros. There’re ways to see this – you got inbuilt methods, brand software, or tools made by others – and knowing what’s a safe level for your type of GPU. This would mean your performance is great and you steer clear of damage. Don’t forget, eyeing your CPU temp together with your GPU helps keep your whole system stable. This guide helps you with the knowledge and tools you need, helping you keep your PC cool, quiet, and running slick for gaming or professional stuff.
Until next time, fellow gamers and pros, Ciao! ✌️


